INTRODUCTION
Economists use mathematical and statistical tools, including measures of dispersion such as variance and standard deviation, to analyse data and solve problems. These tools help in making decisions about production, prices, income, and employment. In this lesson, we will study some basic tools used in economic analysis.
THE RANGE
The range is a simple statistical measure that shows the extent of variation in a set of data by comparing the highest and lowest values. It is calculated by subtracting the smallest value from the largest value in the data.
The range helps to give a quick idea of how wide or narrow the spread of the data is, making it easier to understand differences in economic variables such as prices, income, or production levels.
Formula
Range = Highest value – Lowest value
Example 1
Data Set: 5, 8, 10, 15, 20
Range = 20 – 5 = 15
Importance in Economics
The range is important in economics because it helps to show how widely data values differ within a given period. For example, economists use the range to understand fluctuations in prices, income, production, and unemployment.
A large range indicates high variation and possible instability in the economy, while a small range shows more stability and consistency. This information helps government and businesses to make decisions about pricing, planning, and policy, especially when analysing trends and comparing economic performance over time.
QUARTILES
Quartiles are statistical values that divide a data set into four equal parts, helping to describe the distribution of the data. The first quartile (Q1) separates the lowest 25% of data from the rest, the second quartile (Q2) represents the median, and the third quartile (Q3) separates the highest 25% from the rest. Quartiles provide a clearer picture of how data is spread, which is especially useful in economics for analysing income distribution, prices, and other variables.
Example 2
Determine the quartiles in the data set below.
2, 4, 6, 8, 10, 12, 14
Median (Q2) = 8
Q1 = 4
Q3 = 12
Importance
Quartiles are important in economics because they help to analyse the spread and distribution of data, particularly in income and wealth studies. By dividing data into four equal parts, quartiles allow economists to identify the position of specific values, compare the distribution among different groups, and detect disparities. This is useful for evaluating income inequality, pricing strategies, and assessing the performance of different sectors of the economy, as it highlights which segments of the population or market hold higher or lower values.
MEAN DEVIATION
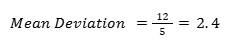
Mean deviation is a statistical measure that shows the average distance of each data value from the mean of the data set. It is calculated by finding the difference between each value and the mean, ignoring the negative signs, and then averaging these differences. This measure helps to understand how spread out the data is, making it useful in economics for analysing variations in prices, income, production, or other economic variables.
Steps
-
Find the mean.
-
Find the deviation of each value.
-
Ignore negative signs.
-
Find the average.
Example 3
Find the mean deviation of the data set below
2, 4, 6, 8, 10

|
Data |
Deviations |
Positive |
|
2 4 6 8 10 |
-4 -2 0 2 4 |
4 2 0 2 4 |
|
12 |
VARIANCE
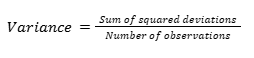
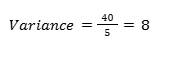
Variance is a statistical measure that indicates how much the values in a data set deviate from the mean on average. It is calculated by taking the squared differences between each value and the mean, and then finding the average of these squared differences. In economics, variance is useful for understanding the variability or risk in data such as prices, income, production, and investment, helping to make informed decisions and forecasts.
Formula
Example 4
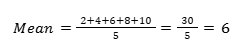
Find the variance of the data set below
2, 4, 6, 8, 10
|
Data |
Deviations |
Squared |
|
2 4 6 8 10 |
-4 -2 0 2 4 |
16 4 0 4 16 |
|
40 |
Importance
Variance is important in economics because it provides a measure of how much data values differ from the mean, which helps to understand the degree of variability or risk in an economic variable. For example, a high variance in prices or investment returns indicates greater uncertainty, while a low variance shows more stability. This information is useful for businesses, investors, and policymakers when making decisions, planning for risk, and forecasting economic trends.
STANDARD DEVIATION
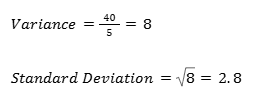
Standard deviation is a statistical measure that shows the average amount by which individual data points differ from the mean of the data set. It is calculated as the square root of the variance, providing a measure in the same units as the original data. In economics, standard deviation is widely used to assess risk, volatility, and stability in variables such as prices, income, production, and investment, helping businesses and policymakers make informed decisions.
Example 5
Find the standard deviation of the data set below
2, 4, 6, 8, 10
|
Data |
Deviations |
Squared |
|
2 4 6 8 10 |
-4 -2 0 2 4 |
16 4 0 4 16 |
|
40 |
Importance
Standard deviation is important in economics because it provides a clear measure of how much data values deviate from the mean, helping to assess risk, stability, and fluctuations in economic variables. A high standard deviation indicates greater volatility, such as in prices, investment returns, or production levels, signalling higher risk, while a low standard deviation shows stability and predictability. This information is essential for businesses, investors, and policymakers when making decisions, planning strategies, and forecasting trends, allowing them to prepare for possible variations and uncertainties in the economy.
SUMMARY
Basic mathematical and statistical tools help economists to understand and analyse economic problems. They help in decision-making and planning.
Read More: Key Facts About Perfect Competition You Shouldn’t Miss